Most people are familiar with the concepts of the mean, median, and mode. They are measures of the central tendency of a value that has measured in a given population. They tell us, in different ways, about the value of an attribute at the heart of the population, rather than at the positive or negative extremes. Other measures are used to tell us about the variation within a population. One frequently used measure of variation is standard deviation.
Consider the following list of top grossing films as of March 2018 (in nominal USD)
| Film | Year | Gross | Run-time |
| Avatar | 2009 | 2787965087 | 162 |
| Titanic | 1997 | 2187463944 | 194 |
| Start Wars: The Force Awakens | 2015 | 2068223624 | 136 |
| Jurassic World | 2015 | 1671713208 | 124 |
| The Avengers | 2012 | 1518812988 | 143 |
| Furioius 7 | 2015 | 1516045911 | 137 |
| Avengers: Age of Ultron | 2015 | 1405403694 | 141 |
| Harry Potter and the Deathly Hallows – Part 2 | 2011 | 1341511219 | 130 |
| Star Wars: The Last Jedi | 2017 | 1332261619 | 152 |
| Frozen | 2013 | 1290000000 | 102 |
We can calculate the average run-time of a top grossing film to be 142.1 minutes, but this tells us nothing about the variation of run-times within the population. One way we can quantify the variation is by looking at how far each film is from the mean.
| Film | Delta from Mean |
| Avatar | 19.9 |
| Titanic | 51.9 |
| Start Wars: The Force Awakens | -6.1 |
| Jurassic World | -18.1 |
| The Avengers | 0.9 |
| Furioius 7 | -5.1 |
| Avengers: Age of Ultron | -1.1 |
| Harry Potter and the Deathly Hallows – Part 2 | -12.1 |
| Star Wars: The Last Jedi | 9.9 |
| Frozen | -40.1 |
Nice! now we can clearly see variation in film run-times. While this does make things clearer, it doesn’t give us a single measure of variation. It makes sense to find the average distance from the mean, no? But look what happens when we try to do that.
| Film | Delta from Mean |
| Avatar | 19.9 |
| Titanic | 51.9 |
| Start Wars: The Force Awakens | -6.1 |
| Jurassic World | -18.1 |
| The Avengers | 0.9 |
| Furioius 7 | -5.1 |
| Avengers: Age of Ultron | -1.1 |
| Harry Potter and the Deathly Hallows – Part 2 | -12.1 |
| Star Wars: The Last Jedi | 9.9 |
| Frozen | -40.1 |
| Sum | 0 |
We cannot calculate an average because when we add up the deltas, we get 0. This is because the negative values cancel out the positive ones – as one would expect if you think about it. But this average distance from the mean seemed like such a good way to provide a single value that represents the variation in the data. Well, we can get around this issue by squaring the deltas (because squaring any number produces a positive number). So let’s try that.
| Film | Delta from Mean |
| Avatar | 396.01 |
| Titanic | 2693.61 |
| Start Wars: The Force Awakens | 37.21 |
| Jurassic World | 327.61 |
| The Avengers | 0.81 |
| Furioius 7 | 1.21 |
| Avengers: Age of Ultron | 26.01 |
| Harry Potter and the Deathly Hallows – Part 2 | 146.41 |
| Star Wars: The Last Jedi | 98.01 |
| Frozen | 1608.01 |
| Sum | 5334.90 |
Here’s a visualization of what we just did.
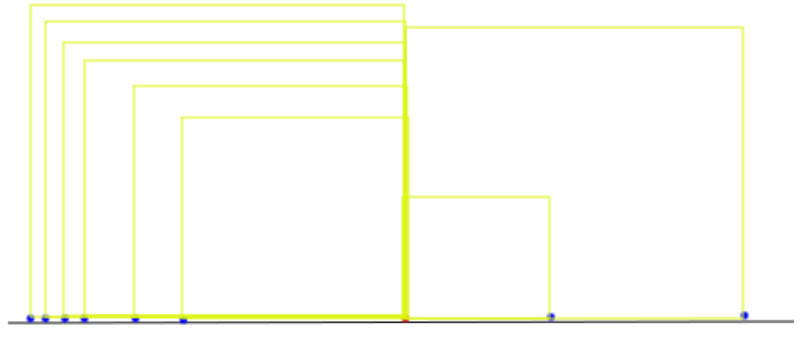
The red dot in the center of the number line is the mean of the run-time values (i.e. { 162, 194, 136, 124, 143, 137, 141, 130, 152, 102 }). The blue dots are distance of each film’s run-time from the mean (i.e. { 19.9, 51.9, -6.1, -18.1, 0.9, -5.1, -1.1, -12.1, 9.9, -40.1 }, 2 points omitted due to space constraints). The yellow squares are the distances (deltas) squared. Now, since we have a sum which we can divide by the total number of films to calculate an average, we can produce a single number that represents the variance.
variance = sum of squares/number of squares = 5334.90/10 = 533.49
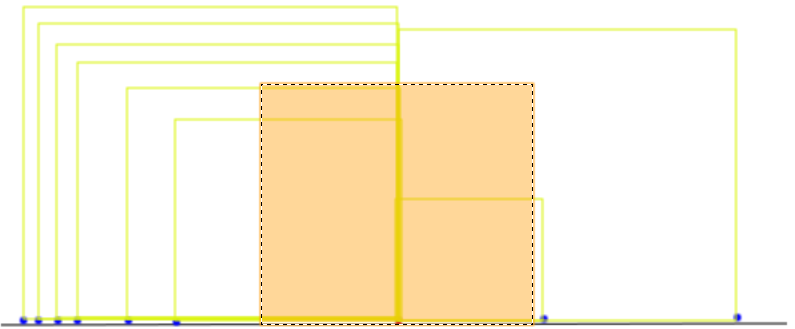
In the the graphic above, I tried to illustrate the variance as the average of these squares – shown in orange, not to scale. Now to relate back to our original values, we simply take the square root of the variance. This square root of the variance is called the standard deviation. It is a single value that tells us how dispersed the values are within a data set. It’s shown below as the green line.
standard Deviation = √variance = √533.49 = 23.10
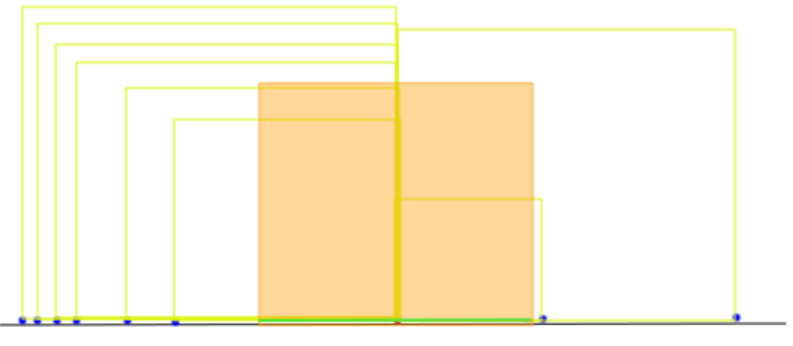
The standard deviation of running times the top 10 grossing films as of the time of the writing of this blog is 23.1 minutes.