I recently started a group on Meetup.com for folks interested in computer programming. This was my first time doing so, and I had not worked out where the group would actually meet up. The first step to fining a meet-up spot was to look at the membership role and find where the individuals were located. I figured Python and the data analysis library Pandas could help me with this task.
Determining Regions
The group was formed for the Island of Maui, and members signed up from many different regions. Not only am I new to leading a Meetup group, I’m also relatively new to Maui. I know where to go for work, where to shop, and where I live; but I don’t know the rest of the island well. So, I went to mapquest.com and looked up where some of our larger cities/towns were located. I then partitioned them off into regions.
regions = {
    'west': ['Lahaina', 'Kapalua', 'Kaanapali'],
    'central': ['Kahului', 'Wailuku'],
    'upcountry': ['Haiku', 'Kula', 'Makawao'],
    'east': ['Hana'],
    'south': ['Kihei']
}
Matching Members to Regions
Next, I downloaded the membership roll from Meetup.com as a CSV file and opened it using Pandas.
import pandas as pd

members = pd.read_csv('MemberList-05.05.18.csv')
members = members[['Name', 'Location']]
Now I had the following dataset.
               Name     Location
0          Jane Doe    Haiku, HI
1          John Doe  Wailuku, HI
2          John Doe  Makawao, HI
3          John Doe    Kihei, HI
4      Jason Favrod  Makawao, HI
5          John Doe  Kahului, HI
6          John Doe  Wailuku, HI
7          John Doe  Lahaina, HI
8          John Doe    Kihei, HI
9          John Doe    Haiku, HI
10         John Doe     Kula, HI
11         John Doe  Lahaina, HI
12         John Doe    Kihei, HI
13         John Doe    Haiku, HI
14         John Doe     Paia, HI
15         John Doe    Kihei, HI
16         John Doe    Kihei, HI
17         John Doe    Kihei, HI
18         John Doe  Wailuku, HI
19         Jane Doe  Makawao, HI
With that, I just looped over the cities in the regions and added the region of each user to their row in the dataset.
# Create a new variable to contain the dataset with the new region information
member_locations = None

for region in regions:
    for city in regions[region]:
        # Select the members in this city.
        mems = members[members['Location'] == city+', HI']

        if (len(mems)):
            # Add the 'region' column with this region value.
            mems['region'] = region

            # Build up the member_locations dataFrame.
            member_locations = pd.concat([member_locations, mems])
Now we can see what region our members are in.
               Name     Location     region
7          John Doe  Lahaina, HI       west
11         John Doe  Lahaina, HI       west
5          Jane Doe  Kahului, HI    central
1          John Doe  Wailuku, HI    central
6          John Doe  Wailuku, HI    central
18         John Doe  Wailuku, HI    central
0          Jane Doe    Haiku, HI  upcountry
9          John Doe    Haiku, HI  upcountry
13         John Doe    Haiku, HI  upcountry
10         John Doe     Kula, HI  upcountry
2          John Doe  Makawao, HI  upcountry
4      Jason Favrod  Makawao, HI  upcountry
19         John Doe  Makawao, HI  upcountry
3          John Doe    Kihei, HI      south
8          John Doe    Kihei, HI      south
12         John Doe    Kihei, HI      south
15         John Doe    Kihei, HI      south
16         John Doe    Kihei, HI      south
17         John Doe    Kihei, HI      south
Charting the Results
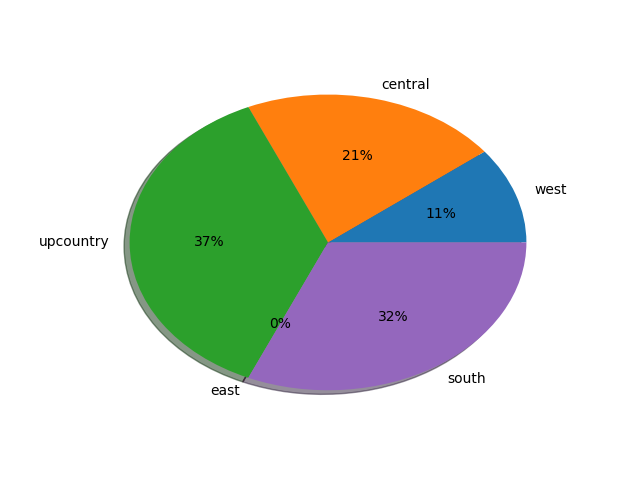
Ok, now it’s easier to see who’s where. But to make it even clearer, I can draw up a pie chart.
import pylab
import matplotlib.pyplot as plt

# Count how many members are in each region.
# Overwrite the region cities with the count.
for region in regions:
    regions[region] = len(member_locations[member_locations['region'] == region])


# Draw and show the pie graph.
plt.pie(list(regions.values()), labels=regions.keys(), autopct='%.0f%%', shadow=True)
pylab.show()
